
Successful Launch of the Fleet Contest
posted
by David Coy, Fleet Data Analyst
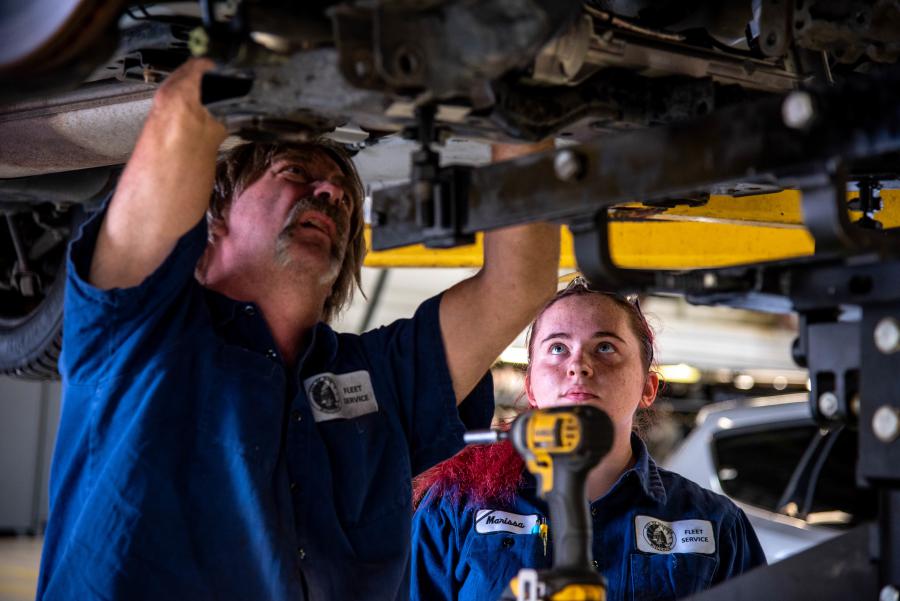 Last fall, Fleet sponsored its first-ever agency-wide performance contest. The first iteration of our contest ran from September 3rd 2019 through December 31st 2019. In this contest we looked at 6 different performance metrics that are key to the success of Fleet’s operations; Vehicle Out of Service, Preventative Maintenance Inspections (PMs) Overdue, Comebacks, Direct Time, Undocumented Sick Time, and Worker’s Comp.
We were inspired to initiate this project by an external presentation our management saw at the Government Fleet Expo: City of Baltimore’s Department of General Service contest for their own fleet technicians, which has resulted in substantial improvements and cost savings. We are achieving similar goals here in Madison within a short time period.
Metrics- Definitions
-
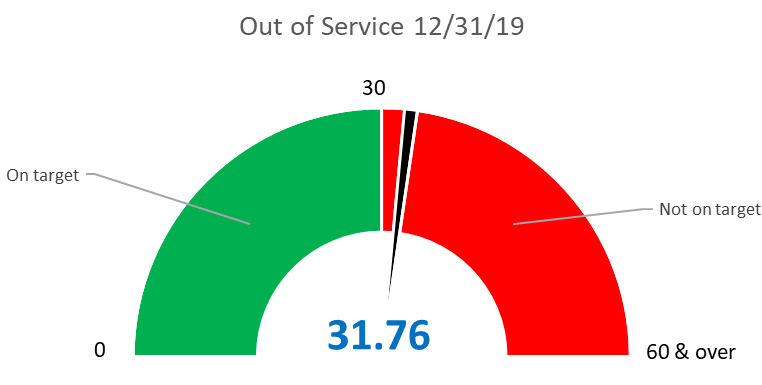
Out of Service is when a vehicle is down and cannot be used. This occurs when the vehicle is actively being worked on, or the vehicle is not safe to be driven. Our contest goal for the daily average was 30, which is very ambitious.
-
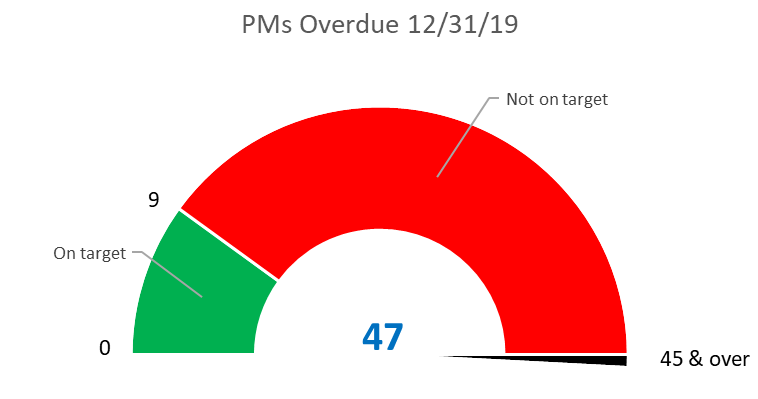
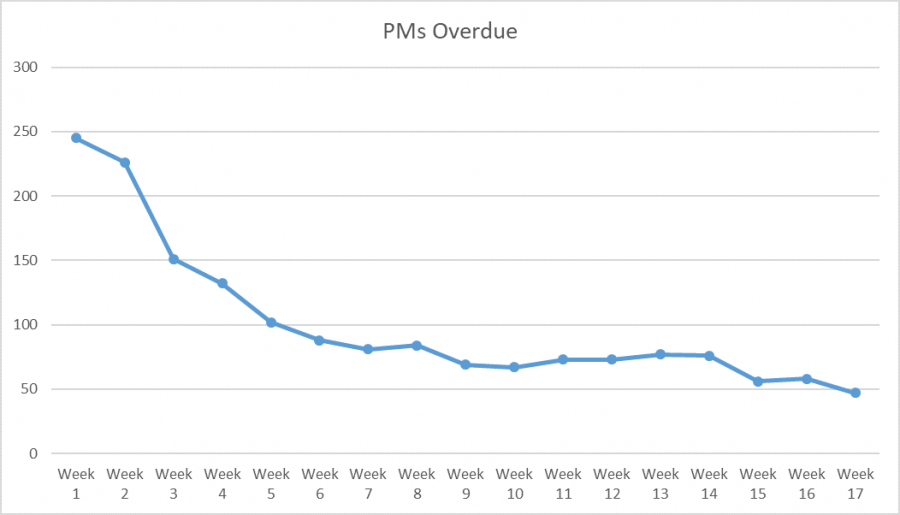
PM Overdue is when a vehicle’s scheduled Preventative Maintenance or “health checkup” has not been completed. Our goal was 0.
-
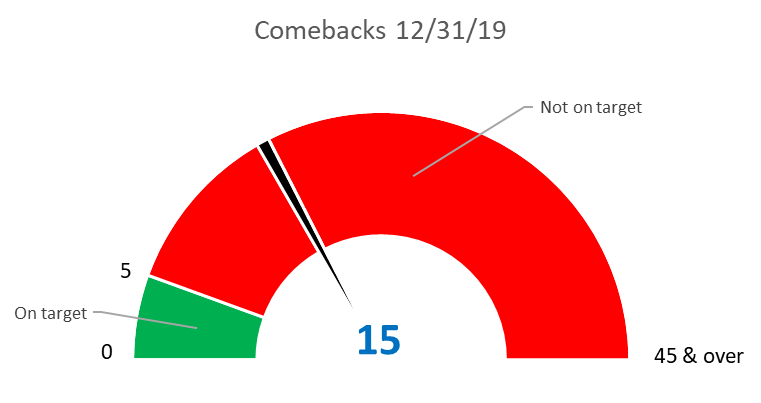
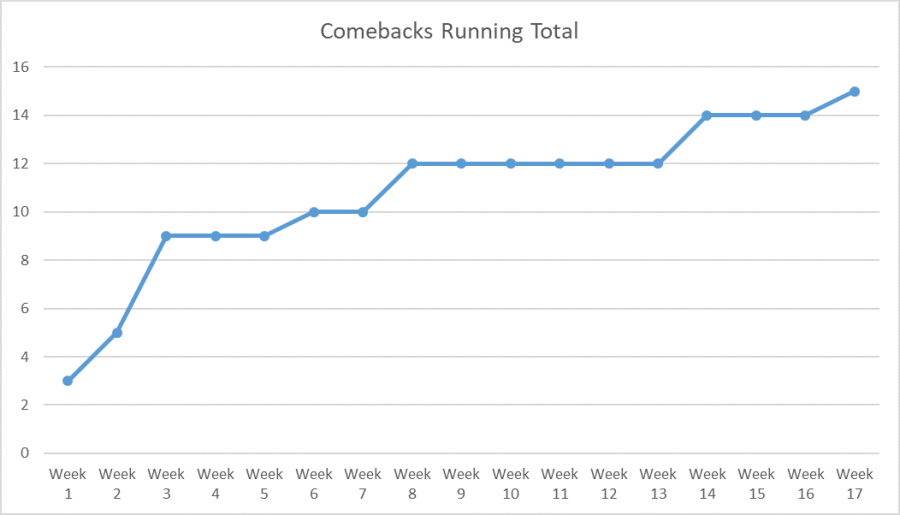
Comebacks refers to a vehicle returning to the shop with the same mechanical issue within two weeks that was supposed to have been repaired the previous time. This is a critical metric as it measures the quality of our work, and is used as an industry standard in the automotive business. Our goal was 0.
-
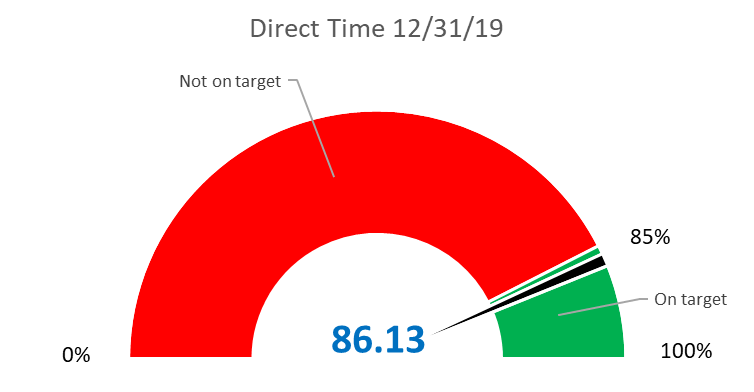
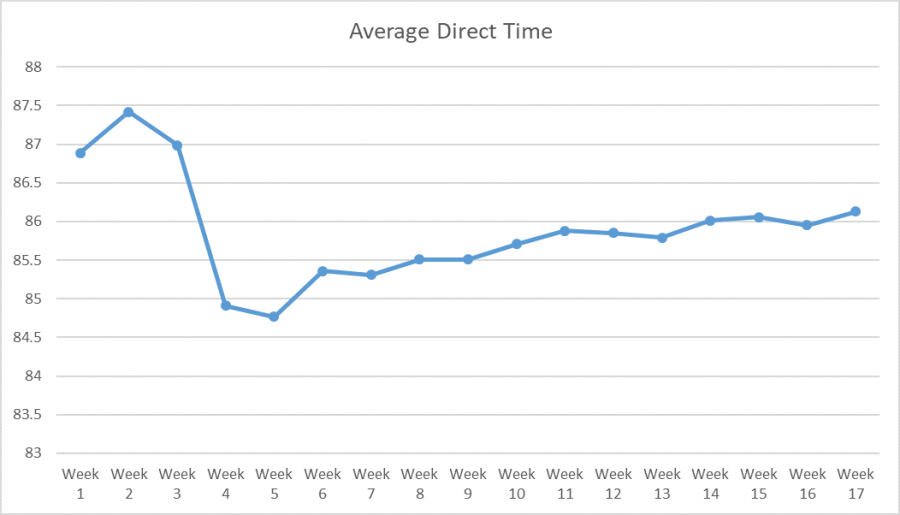
Direct Time is the time our technicians are actively working on a vehicle. With an efficient system, technicians should always have a vehicle to work on and not have to wait for something to be assigned to them. Indirect time also includes breaks, meetings, travel time, etc. with a goal of capping it at 15%.
-
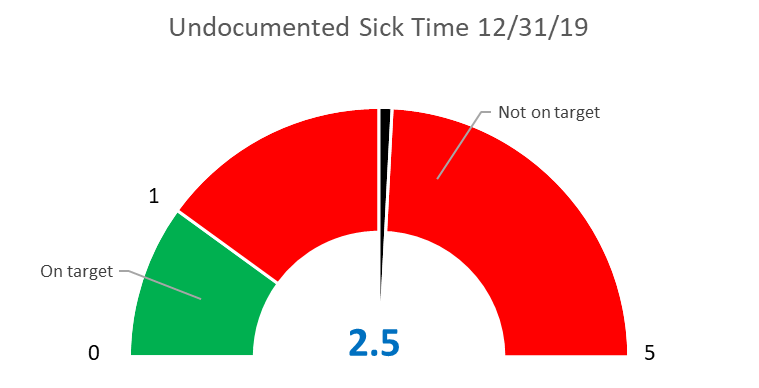
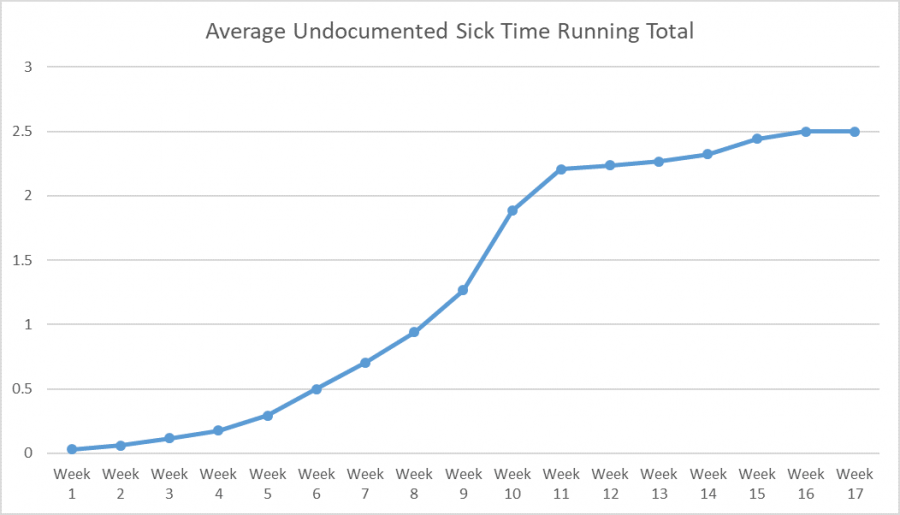
Undocumented Sick Time is the number of instances staff have called in sick without a doctor’s note. Our goal was 0.
-
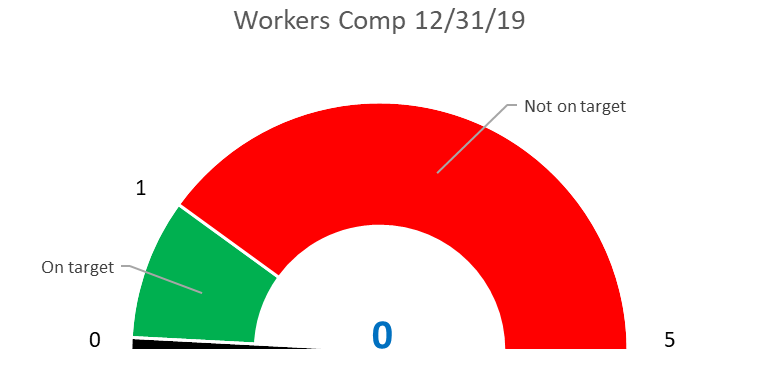
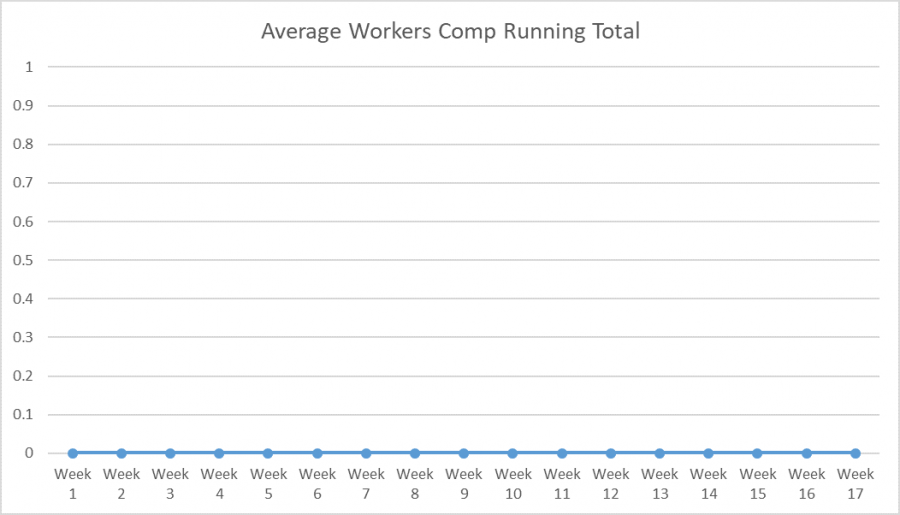
Worker’s Comp is the amount of worker’s comp incidents in the time period. Our goal was 0.
Contest Structure
Launching this contest was actually the case study question in my job interview and the panel grilled me on it. Once hired, I was tasked with implementing what was discussed in that interview. To determine how the contest would be set up, we talked to every technician and got their input on how they would like the contest to look among all the different options. The final 6 criteria to be used were debated upon for several months. It was decided by consensus that the contest was going to be all Fleet as one team aiming to meet a shared goal rather than separating facilities into different teams or individual scores, like Baltimore and other fleet contests. We assigned a weight and point value to each metric, and then set up tiers to determine how many points Fleet would get.
Highlights
-
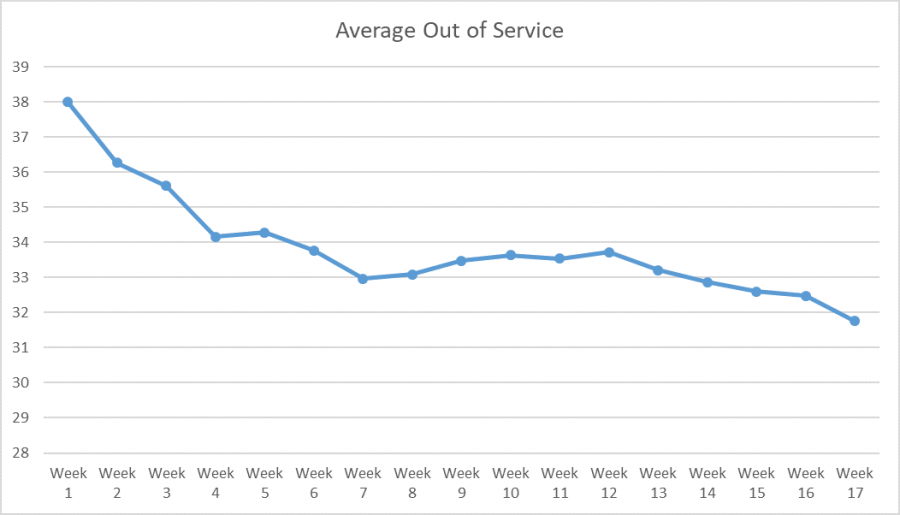
We reduced our out of service from 38 vehicles on average to 31.76 vehicles out of service on average, a dramatic improvement of 16%.
-
We reduced our PM overdue from 247 to 47, or about a whopping 81%. Our out of service numbers should improve, with less downtime for our customers, if we get PMs done on time by working in concert with them.
-
Direct time target was exceeded. The target was 85% direct time and the team reached 86.13% direct time on average.
-
There were no worker’s comp incidents.
Results
Outcome
Out of the 1,000 points available, Fleet scored 703 points. Given the improvements and goals met, a prize will be given to all staff in a technician title. We are sure we can do better. Now, we are looking at more metrics to add to the contest and adjust a few of the goals for the next time period. By looking at these numbers on a weekly basis, we are able to tackle some issues that were decreasing productivity and efficiency. Now, Fleet’s operations are running smoother thanks to the reduction of several major work backlogs, and because we have better data. We look forward to the next round of the contest, a tradition that we intend to last for many years to come, as well as the improvements it will bring to benefit all the city departments we serve.